Historic data - Charts
Introduction
Charts are available for the following metrics:
- Overview (Grid, Solar and load)
- Battery voltage
- Battery current
- Battery watts
- Battery state of charge
- Battery temperature
- PV power per MPPT
- PV voltage per MPPT
- PV current per MPPT
- Load power
- Essential load power
- Non-essential load power
- Grid power
- Grid voltage
- Grid frequency
- Inverter temperature
- Bus voltage
- AC output voltage
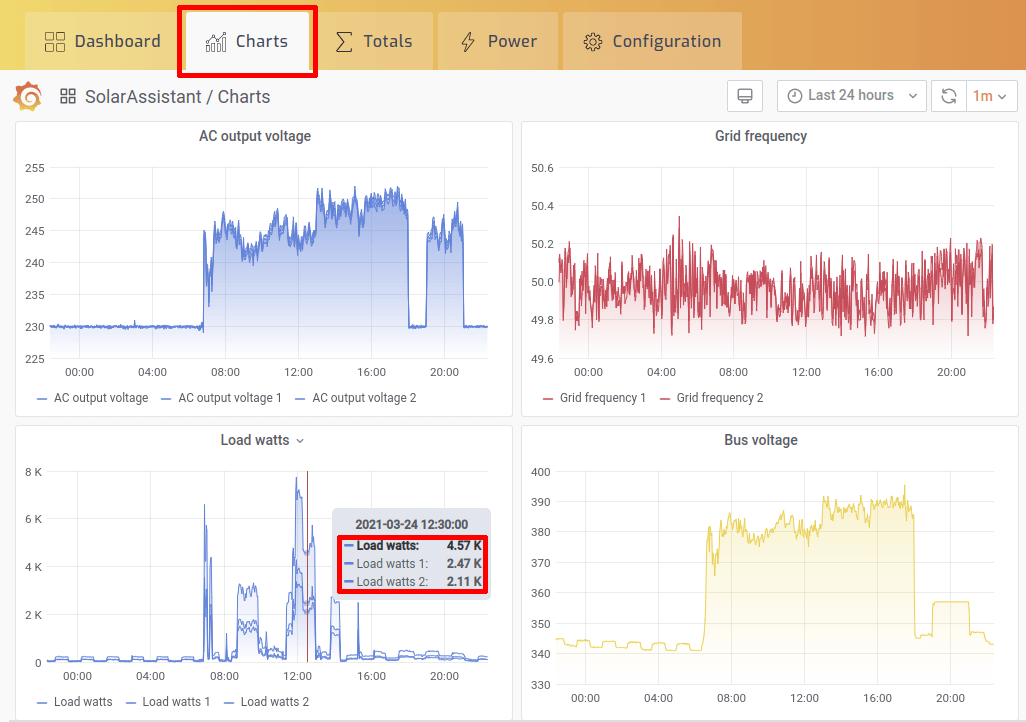
Navigation and content
Open charts by selecting the chart tab. Hovering a chart via web or tapping on the chart via mobile app displays a tooltip of the data at that point in time. If you are running multiple inverters in parallel you will see multiple lines on the chart as in the example below.
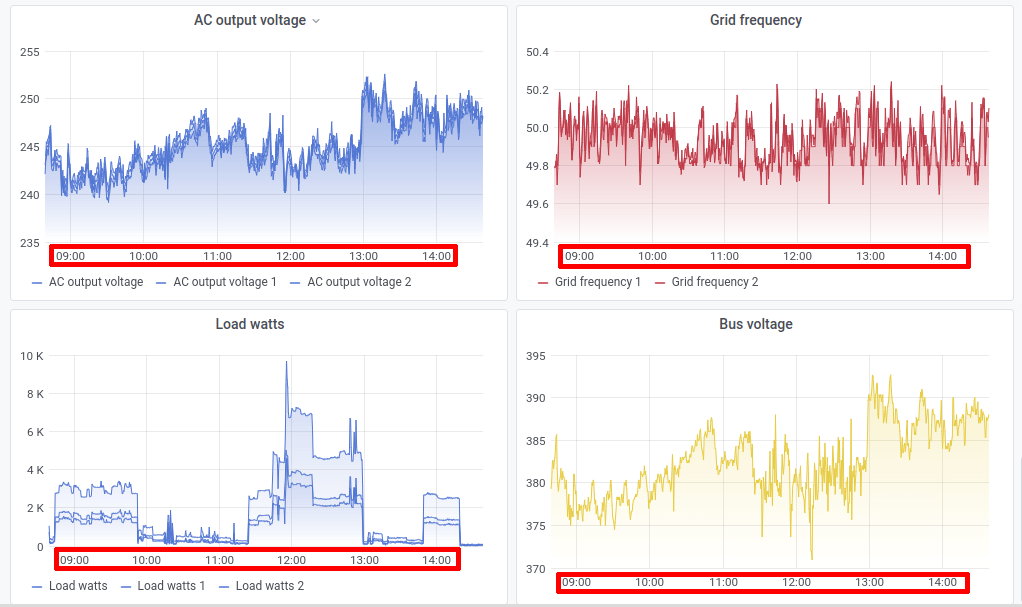
Zoom
To zoom, click and hold to select a region of the chart.
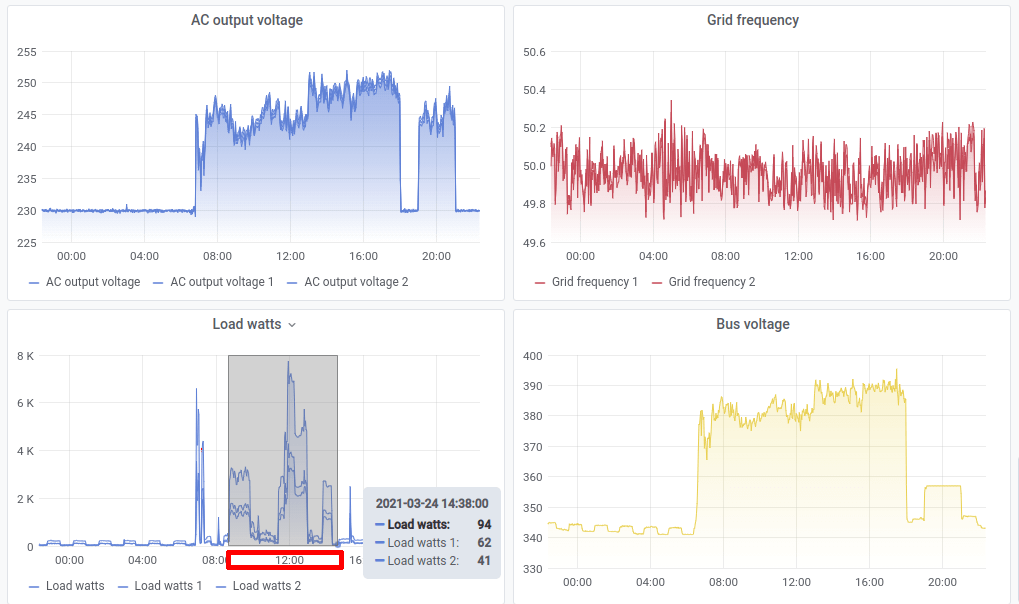
All charts will zoom to the selected time range.
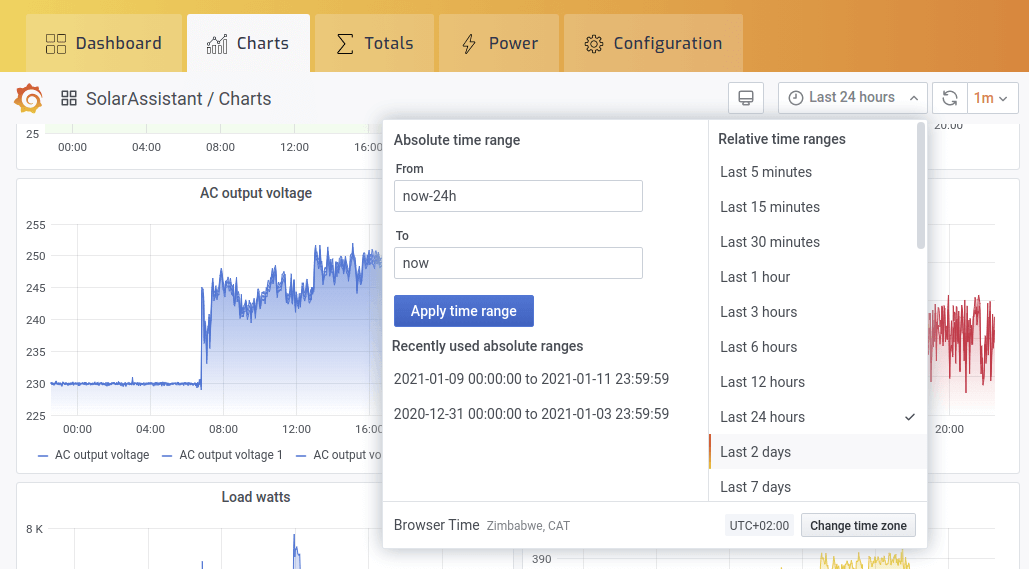
Selecting a time range
Use the time range selector if you would like to select a specific range or view historic data.